Kritische Ursachen und Erfolgsfaktoren erkennen
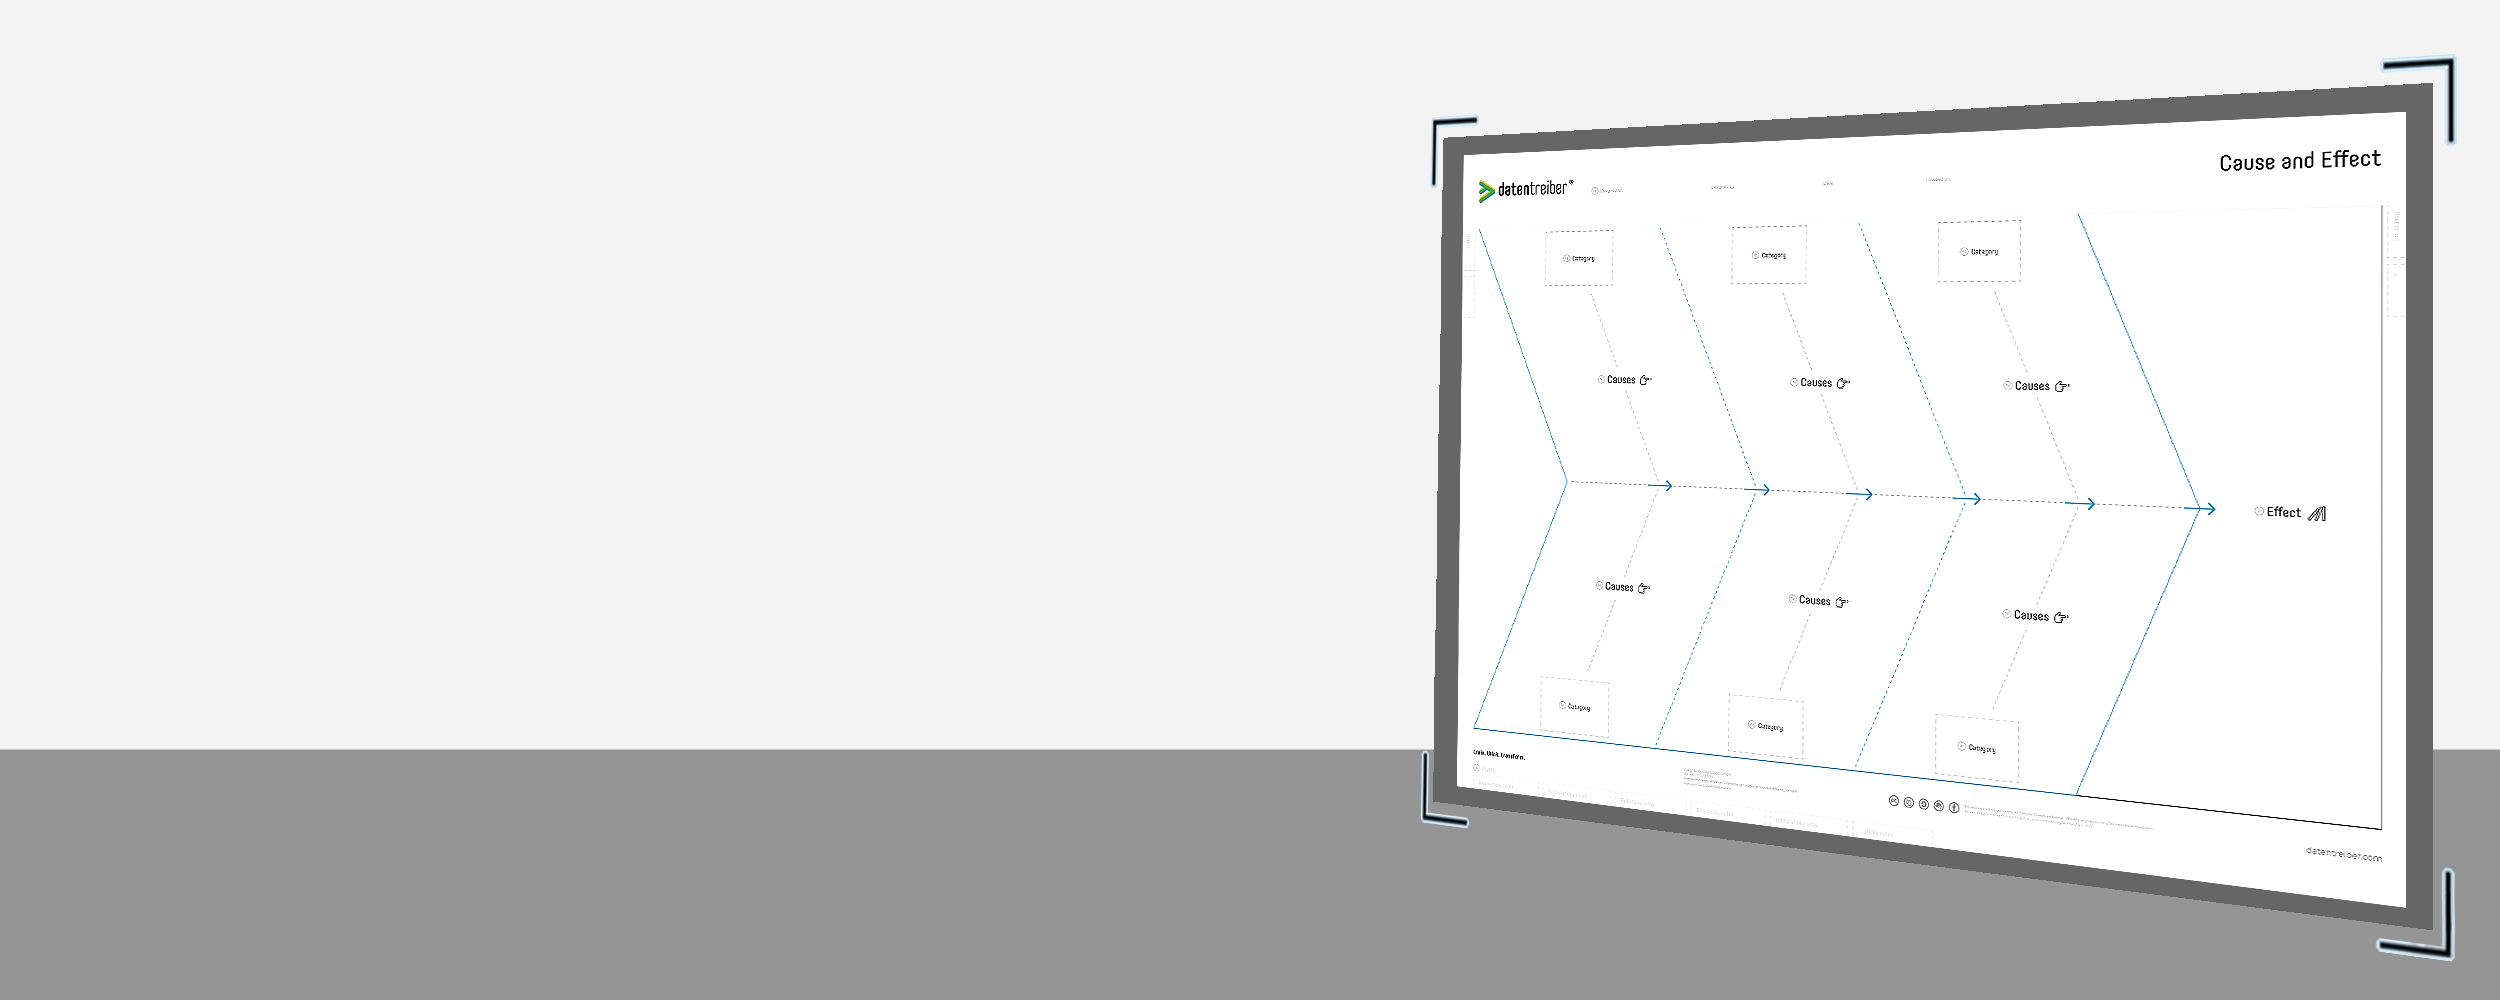
Ursache-Wirkung Canvas
Mit dem Ursache-Wirkung Canvas identifizieren Sie die tatsächlichen Ursachen von Problemen sowie die entscheidenden Faktoren für den Erfolg Ihrer Ziele. Zudem ermöglicht das Canvas eine schnelle und einfache Kategorisierung von Fehlerursachen und Erfolgsfaktoren, um gezielte Maßnahmen abzuleiten.
Was ist das Ursache-Wirkung Canvas?
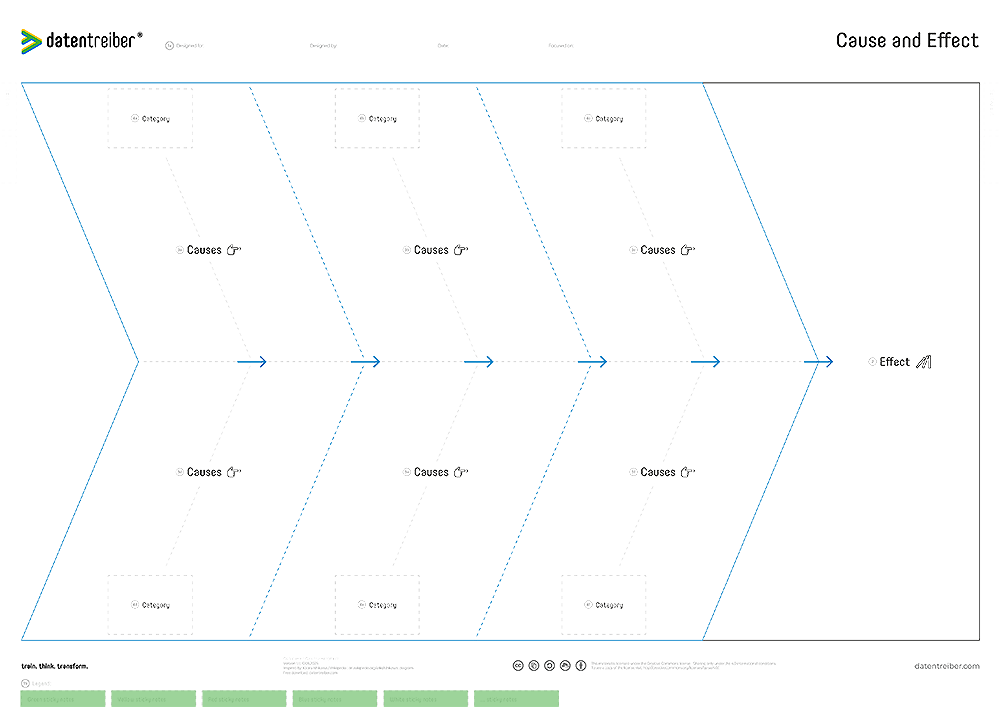
Das Ursache-Wirkung Canvas ist ein strukturiertes Visualisierungstool zur Identifikation von Problemursachen oder zentralen Erfolgsfaktoren. Auch bekannt als Ishikawa-Diagramm oder Fishbone-Diagramm, hilft es dabei, Ursachen und Einflussfaktoren systematisch zu kategorisieren, Abhängigkeiten zu erkennen und den Fokus auf die entscheidenden Elemente zu richten.
Durch die Analyse von Ursachen und Erfolgstreibern unterstützt das Canvas die Problembehebung, Leistungsoptimierung und Zielerreichung. Innerhalb der Data & AI Business Design Methodik kann es zudem zur Visualisierung von Driver Trees genutzt werden, um Einflussfaktoren auf Leistungskennzahlen, Datenqualität und Modell-Ergebnisse abzubilden.
Dank seiner flexiblen Struktur ist das Canvas ein leistungsstarkes Werkzeug für Workshops, Retrospektiven und strategische Planungssitzungen.
Das Ursache-Wirkung Canvas steht kostenlos unter einer Creative-Commons-Lizenz zur Verfügung:
Sie dürfen das Canvas nutzen und anpassen, solange Sie Datentreiber als Quelle nennen.
Wann sollte das Ursache-Wirkung Canvas eingesetzt werden?
Das Canvas eignet sich für eine Vielzahl von Anwendungsfällen:
- Problemdiagnose: Identifizieren Sie die eigentlichen Ursachen von Herausforderungen, die in Retrospektiven oder im operativen Betrieb sichtbar werden.
- Zielerreichung: Bestimmen Sie die zentralen Erfolgsfaktoren für KPIs, OKRs oder Geschäftsziele.
- Driver Tree Mapping: Zerlegen Sie übergeordnete Ziele in messbare Treiber, die Leistung oder Geschäftsergebnisse beeinflussen.
- Datenprodukt-Design: Analysieren Sie Erfolgsfaktoren für Daten- und KI-Produkte, z. B. Datenverfügbarkeit, Modellgenauigkeit oder Nutzerakzeptanz.
- Strategische Entscheidungen: Lösen Sie Herausforderungen in der Prozessoptimierung, Ressourcenverteilung oder bereichsübergreifenden Zusammenarbeit.
Durch die visuelle Darstellung von Ursachen und Einflussfaktoren ermöglicht das Canvas eine effektive Zusammenarbeit, liefert umsetzbare Erkenntnisse und hilft Teams, Prioritäten gezielt zu setzen.
Wie benutze ich das Ursache-Wirkung Canvas?
Beschreibung folgt bald…
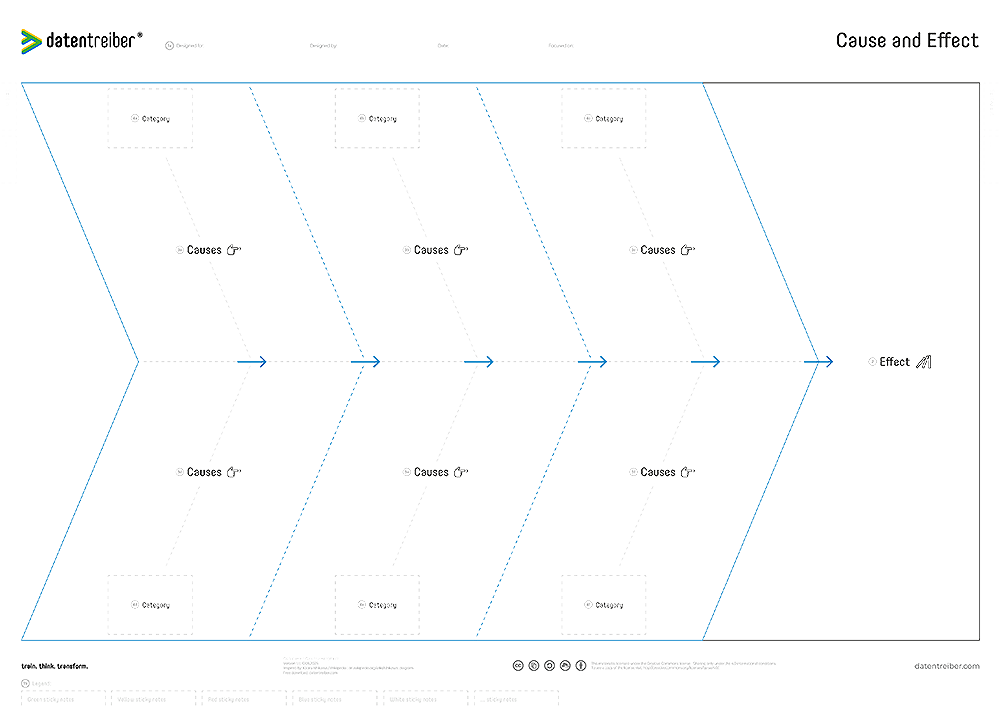
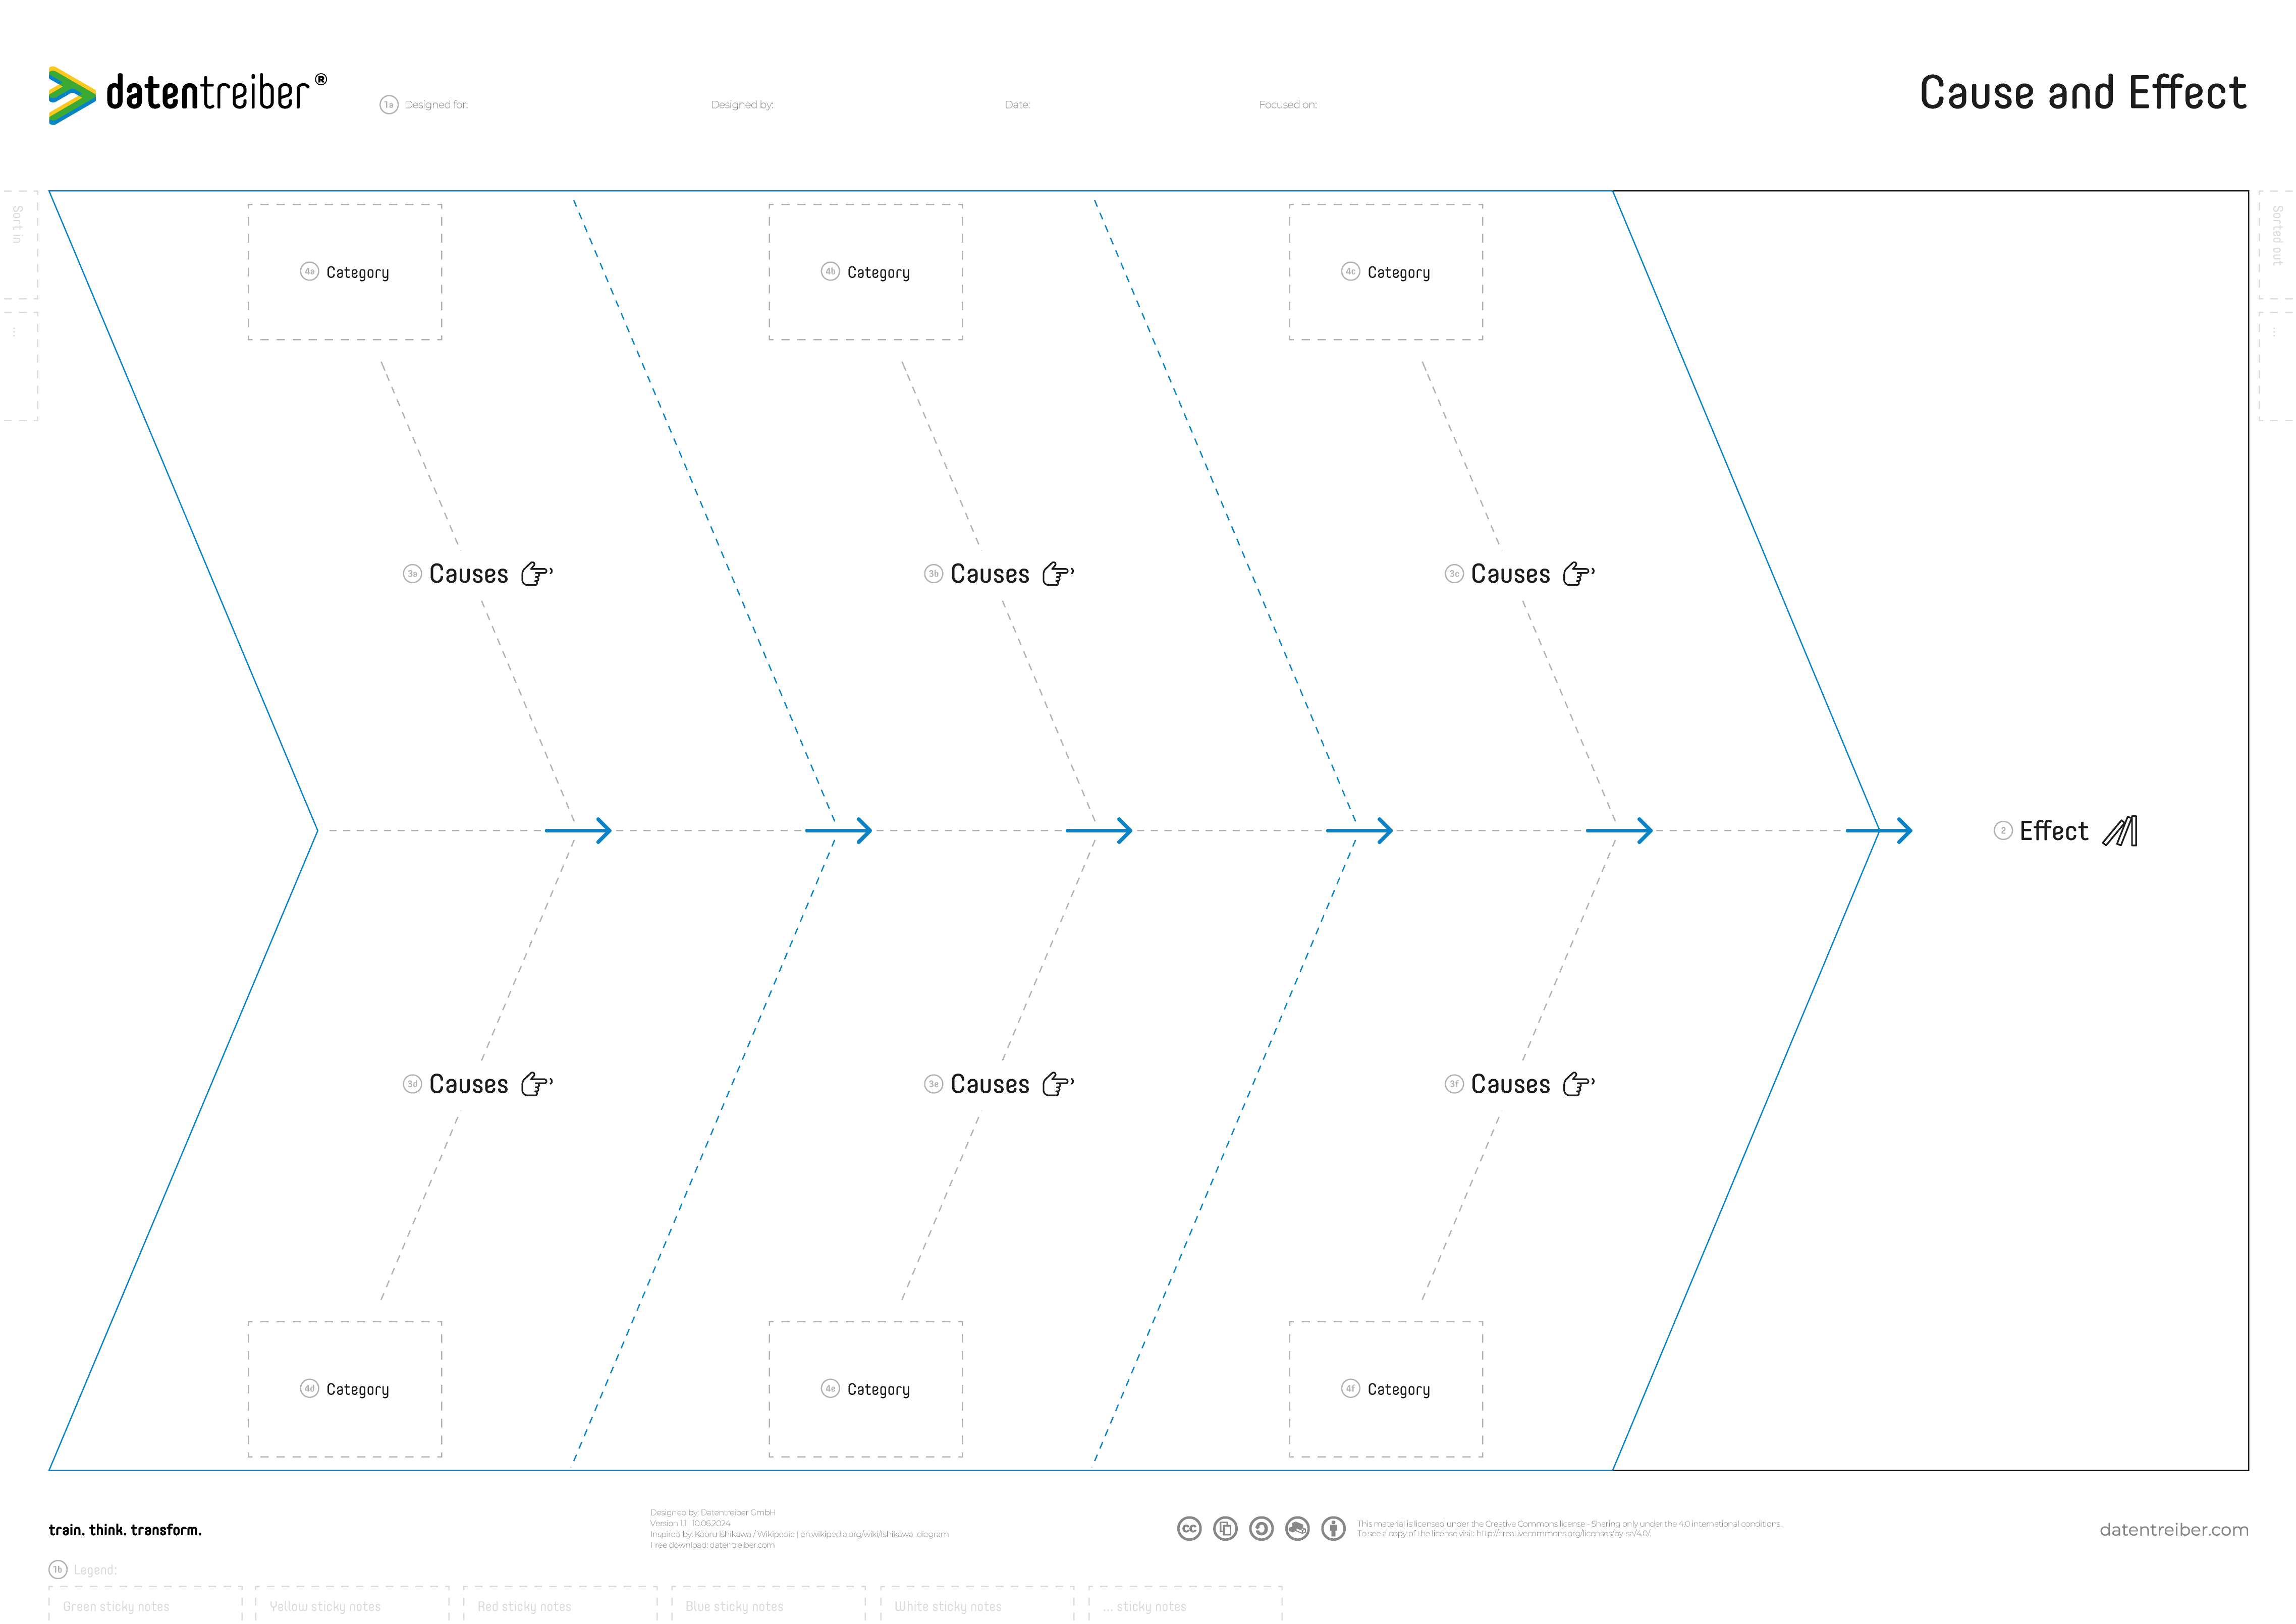
The Canvas Sections
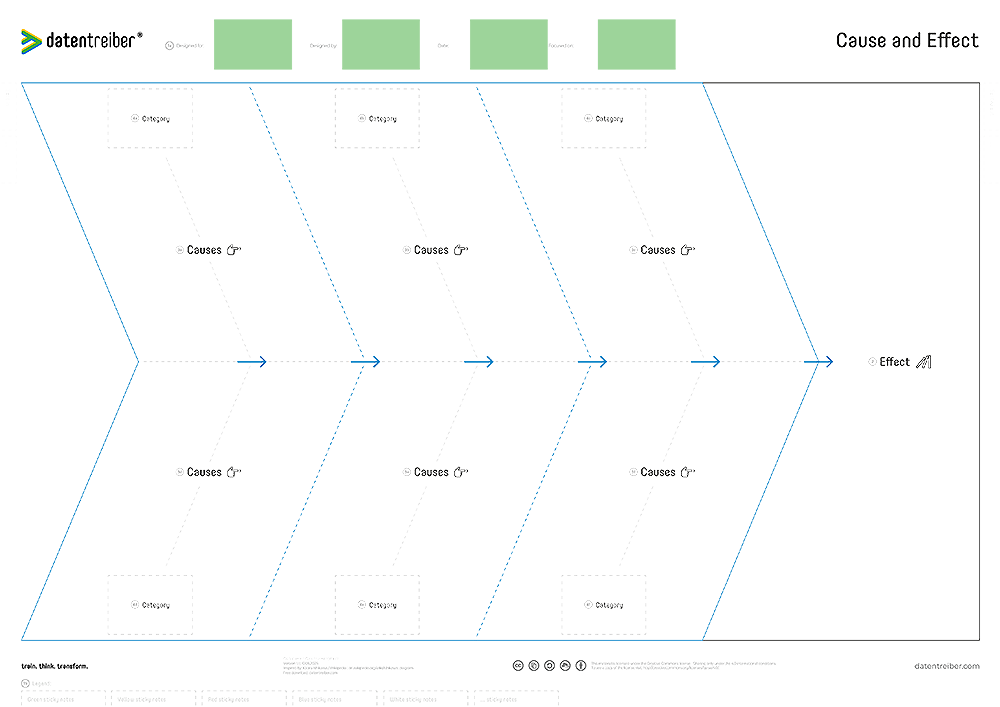
1a Header
This is a Placeholder Text for 1a Header.
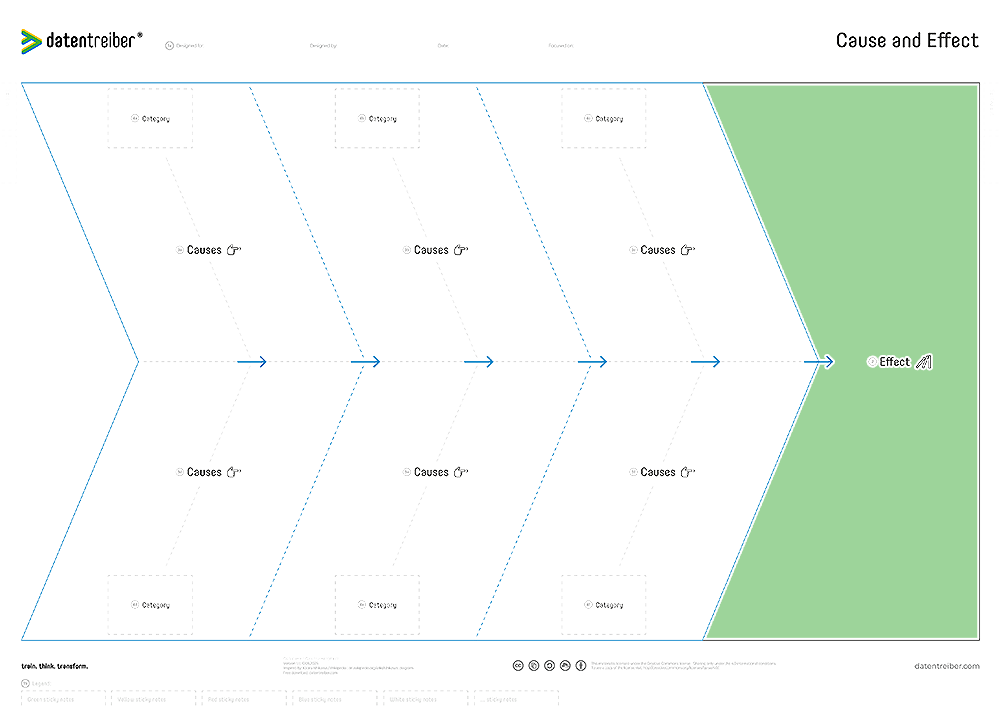
2 Effect
This is a Placeholder Text for 2 Effect.
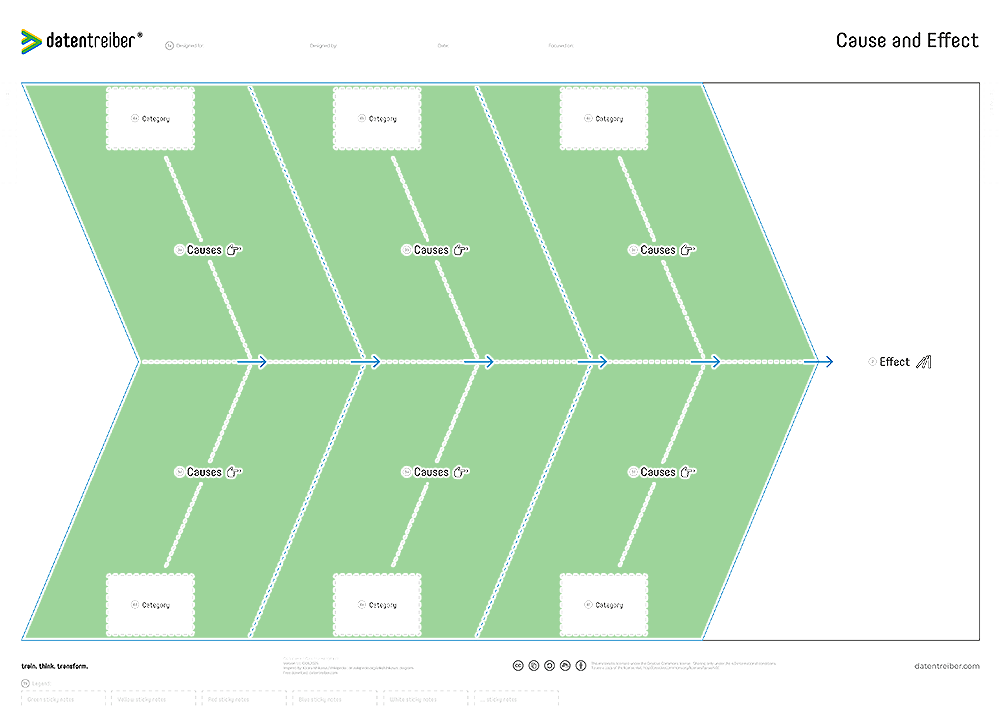
3 Causes
This is a Placeholder Text for 3 Causes.
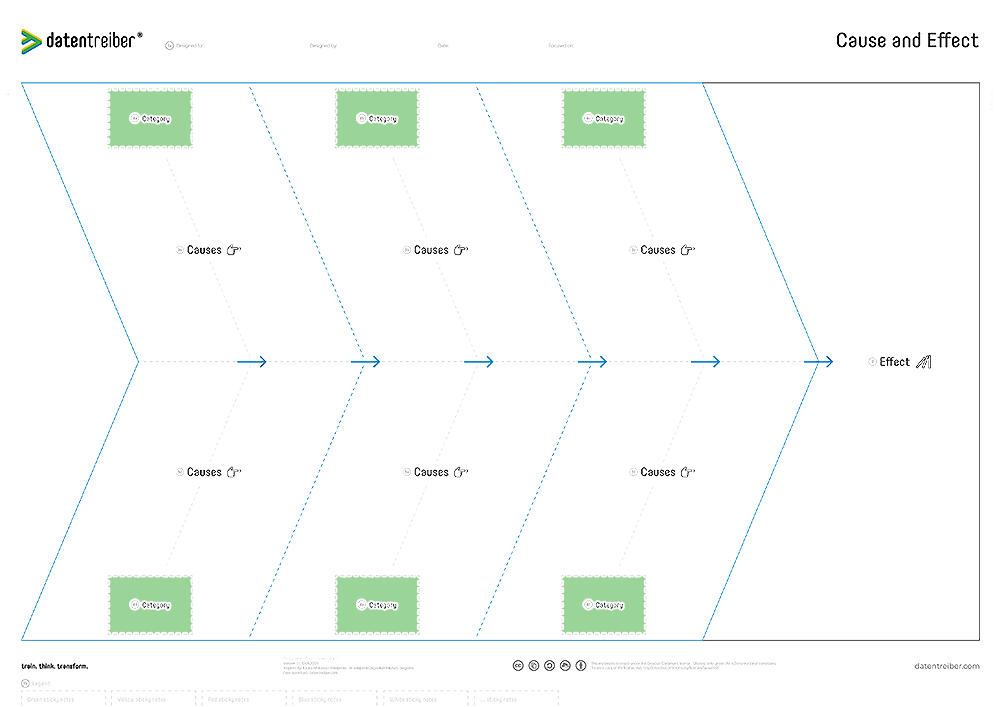
4 Category
This is a Placeholder Text for 4 Category.

Wo finde ich weitere Informationen?
- Detaillierte Anleitungen und Praxisbeispiele zur Nutzung des Canvas im Kontext einer ganzheitlichen Daten- & KI-Strategie finden Sie in unserer Data & AI Design Bench.
- Cause-Effect Diagram (Wikipedia)
- Data Thinker Group (LinkedIn)